Posted 5 May 2020
Quick update:
My posts at the weekend looking at the risks of dying stratified by age, were based on Week 16 data from the ONS (week ending 17 April 2020). I heavily caveated all the posts with a phrase “Week 16 might prove to be the worst week of COVID deaths, but until the Week 17 data are published we will not know for sure”.
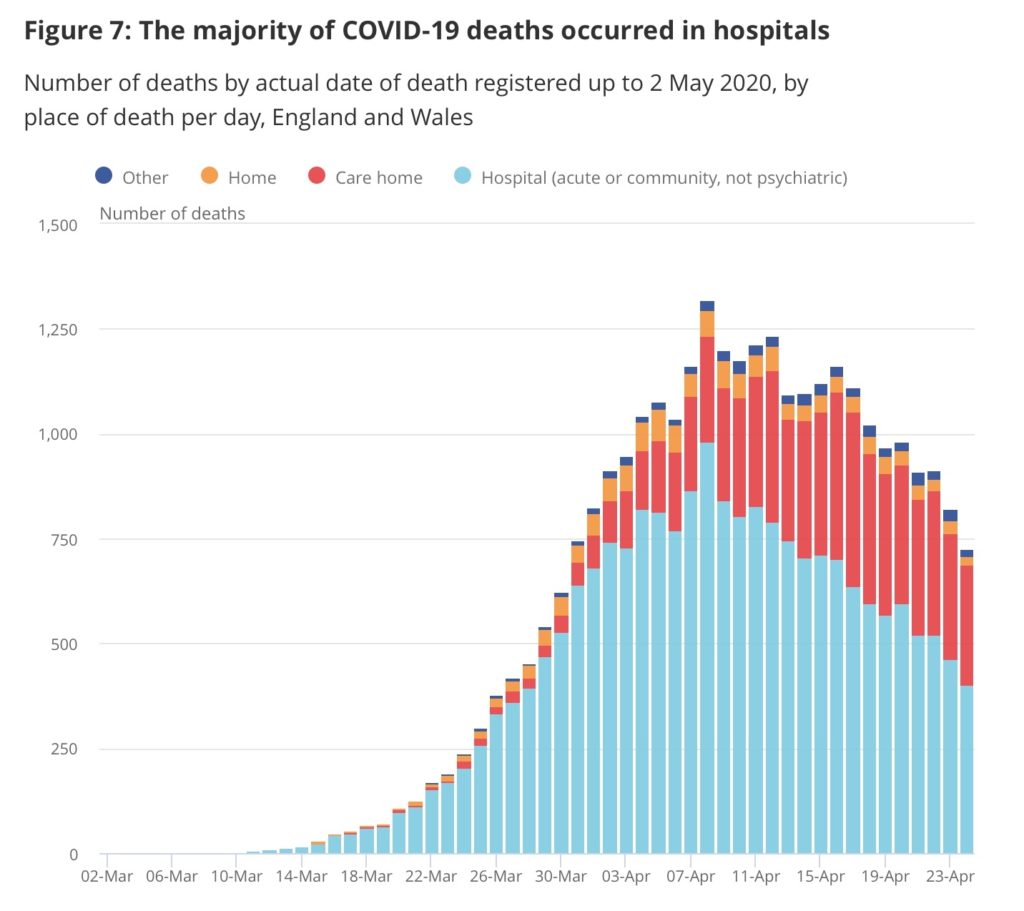
Well Week 17 is published, and yes, Week 16 was the ‘peak week’. Week 17 has fewer deaths and the graph included in the headline report (attached here) shows the trend is definitely downward by the end of Week 17 (24 April).
The time lag with ONS data is worth the wait for the better inclusion of data from all sources. Consider the downward trend by 24 April (in the attached graph) and the fact that we are now at the 5 May. Week 18 data (w/e 1 May) should further that downward trajectory.
This graph nicely shows the relative numbers of deaths in care homes and hospitals though the left hand part of the graph is for a period of time where it was known that deaths in care homes were being under-attributed to COVID-19.