Posted 3 May 2020
Yesterday I published a table of probabilities of dying in Week 16 2020 stratified by age based on provisional ONS data. (Statisticians never write short sentences).
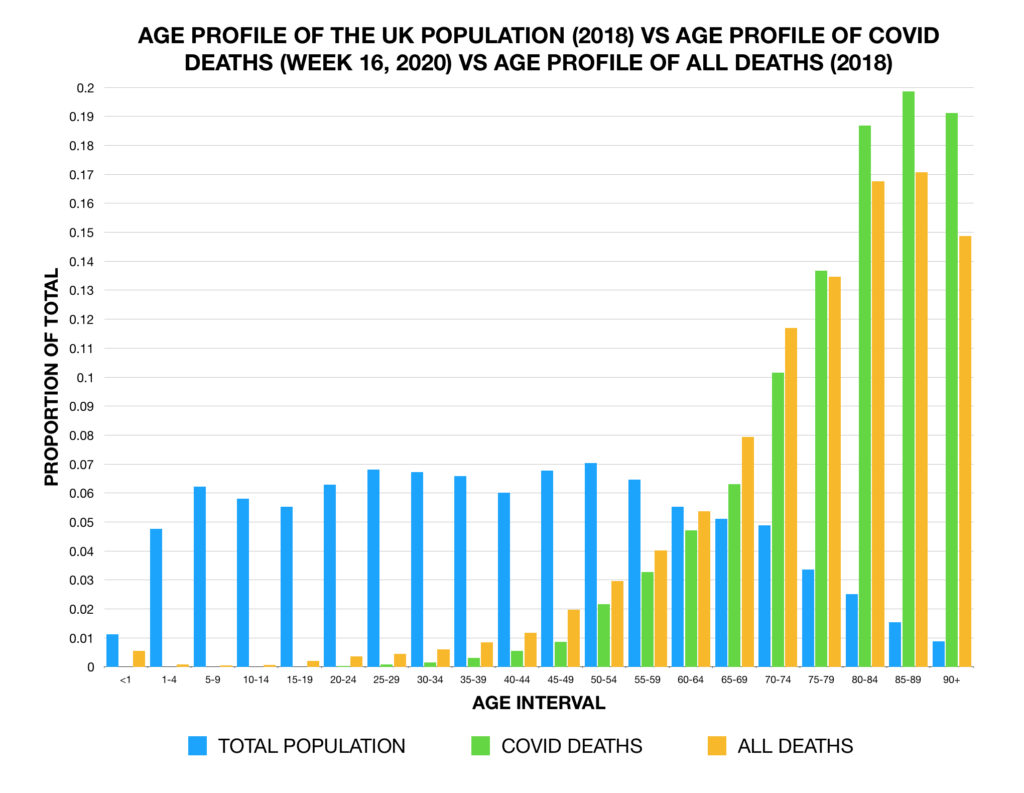
Today, I publish the same data in graphical form – tables are easier to use when you want to ‘look-up’ your age statistic; graphs give an easier view of how that fits-in with everyone else.
This will probably prove to be the week with the highest excess deaths or second only after Week 17. We will know on Tuesday when those data are published. Either way, the graphs below likely represent the bleakest picture.
A few headlines from these graphs:
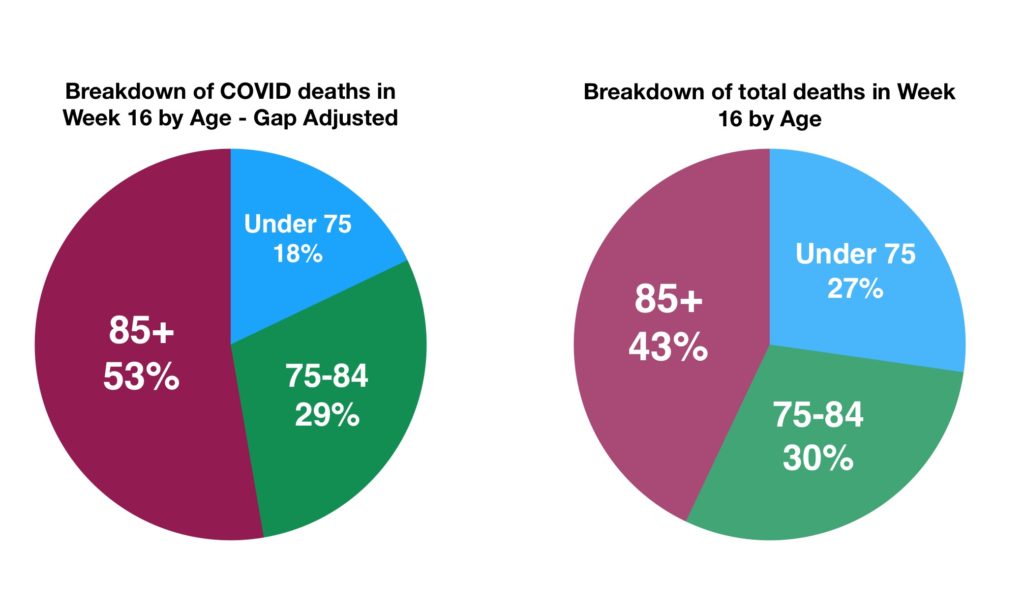
1. Over 80 percent of COVID related deaths occur in the 85 and over age groups.
2. Under 75s, even in Week 16, were still more likely do die of something not related to COVID, even though their overall chance of dying had increased in that week.
3. 75-84 year olds were just as likely to die of non COVID related causes as causes linked to COVID.
4. Over 85s are the only group who were more likely to die with COVID on their death certificate than not.