Posted 12 May 2020
ALL MODELS ARE WRONG, SOME ARE USEFUL
If only this ‘meme’ had been more prevalent a couple of months ago, I wonder how different the course of COVID19 strategies might have been.
Before I discuss today’s ‘model’, let me once more make clear I am not an anti-vaccine person – vaccination programmes have eradicated (and near-eradicated) many infectious diseases and thereby transformed mortality rates in the world population. However, I do not want all discussion of possible secondary consequences of vaccination programmes to be the preserve of a dismissed fringe if there is real data worth exploring. Let not any part of science become a ‘sacred cow’ if there are data to play with.
I saw today some correspondence in the BMJ regarding studies looking at how influenza vaccinations may impact susceptibility to non-virus acute respiratory infections (ARIs). A study in children (an RCT, peer-reviewed study) showed that children given a influenza vaccine had an increased risk of ARIs from non influenza viruses including coronaviruses (cold viruses, SARS-CoV and MERS). The odds ratio in this study was 4.9 (i.e. vaccinated children showed nearly 5 times the risk of infection from non influenza ARIs compared to non-vaccinated children). I have previously reviewed a study of American service personnel in the influenza season of 2017-18 where a similar correlation was observed but with a smaller (but still above 1) odds ratio. Some smaller and older studies have shown no correlation, so the evidence is mixed.
A study published in Germany has also suggested that up to one third of Germans serology tested for adaptive immunity to COVID-19, showed memory T cells reactive to the spike protein of SARS CoV2 (the causative pathogen of COVID19) but their reactivity pattern leads to suggestion that this acquired immunity was derived from other coronavirus infections (possibly the cold virus). That paper hypothesised therefore a link between adaptive immunity to SARS CoV2 and adaptive immunity to other coronaviruses.
So here was today’s thought: Is there a link between patients receiving the influenza vaccine and the severity of their COVID19 outcome (positive or negative)? A point I have made in previous posts is that even if there is a correlation, that does not prove causation (it would not prove the vaccination CAUSED the better/worse outcome). But, the opposite argument is important: if you can show no correlation between receipt of vaccine and COVID19 outcome, then you have pretty much discounted the possibility of there being a causation.
And of course the data are there. OECD data gives me the vaccination of rates of over 65s in 25 European countries (for some countries these are 2018 data; for others 2017 or a year or two earlier).
ourworldindata.org gives me the COVID19 deaths per million of the population for those same 25 countries. (One flaw in my data here is that I do not have either COVID19 death rates just for over 65s in those countries or flu vaccination uptake for all age groups in those countries. I am therefore going to use death rates for the whole population as a proxy for death rates for the over 65s; as over 65s account for the vast majority of COVID19 deaths this should be a robust proxy).
I have plotted my data and that is the first attached figure.
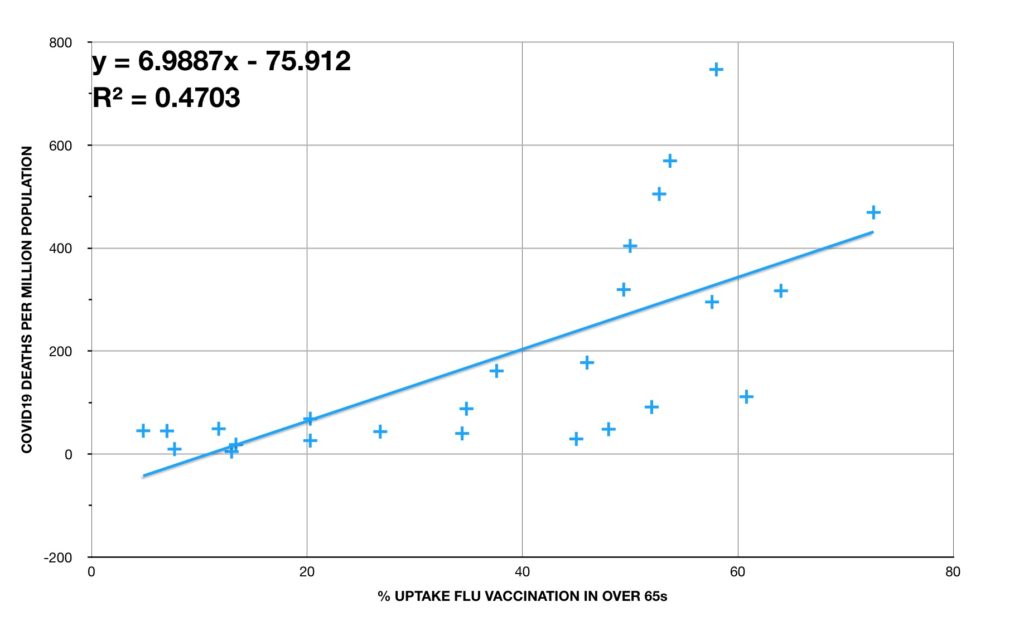
There does seem to be a correlation: “In countries with higher influenza vaccination rates, there are higher COVID19 death rates.”
The correlation is statistically interesting (we use R^2 as a measure of this; the closer R^2 is to 1, the stronger the correlation. For biological systems we generally look for an R^2 greater than 0.5; for social sciences we look for R^2 greater than 0.35. For the best fit line on this graph, R^2 is a little over 0.47).
OK, remember this does not prove causation but as I have not been able to show no correlation (statistics is the science of the double negative), I cannot disprove causation from this analysis alone.
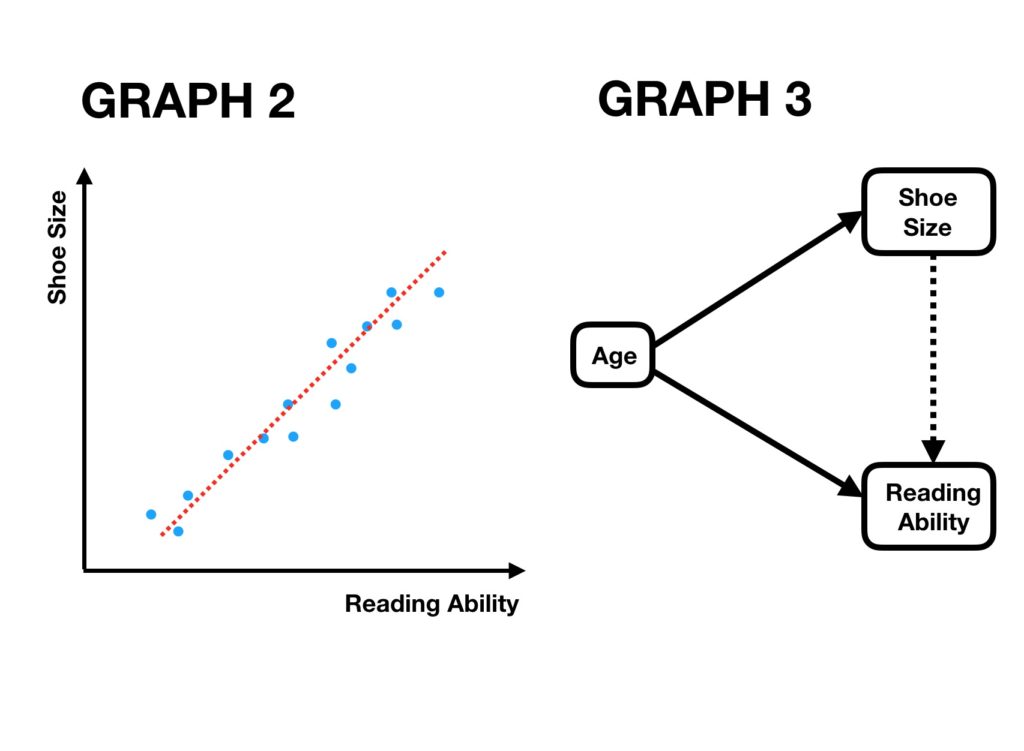
Now, there is important discussion here. Many weeks ago, I looked at the “shoe size and reading age” model. A quick refresh: If you measured shoe size and reading age of children you would notice a correlation (children with an older reading age tend to have a bigger shoe size). This is the Graph 2. But, it would be wrong to think one of those factors CAUSED the other and such thinking would lead to the ‘odd’ thinking that if you wanted to your child to have a bigger shoe size, then work on their reading age. I explained this in a causation diagram whereby the factor of ‘Age’ had been ignored in the starting analysis. If you realise that Age both affects reading age and shoe size, you can then see why shoe size and reading age are correlated but one does not causer the other. These are conveyed in the diagrams in Graph 3.
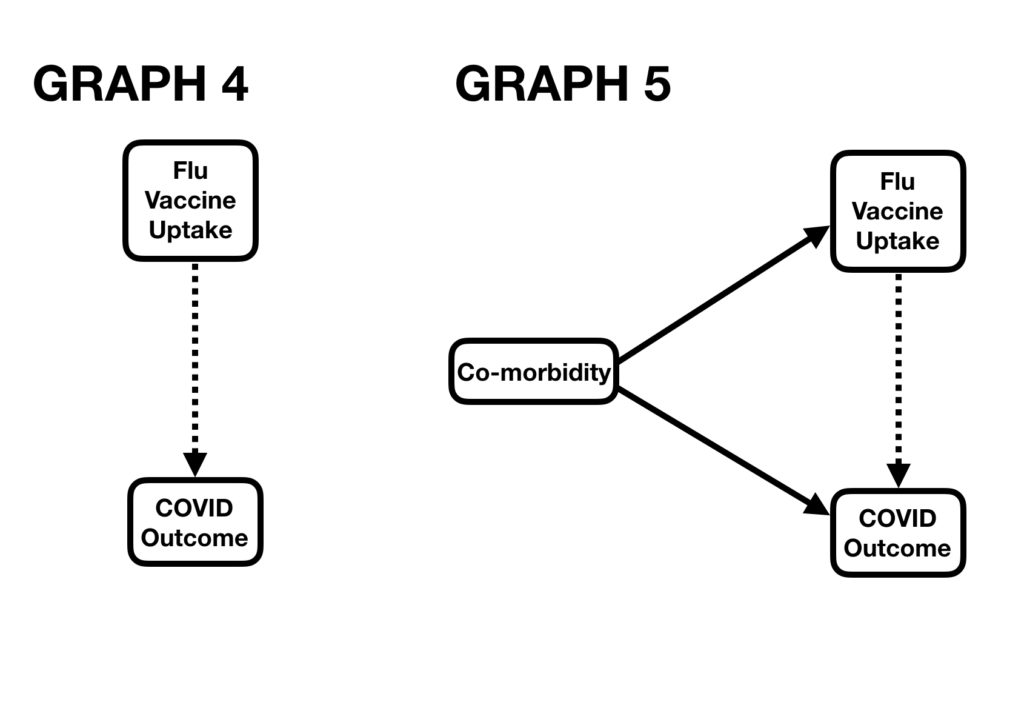
There is the risk of the shoe size fallacy in the vaccine model. Is there a missing factor (like Age in the above model) that explains the link between levels of vaccination and COVID19 outcomes. This is reasonable because influenza vaccinations are administered to sectors of a population more vulnerable to influenza and those same vulnerabilities are almost certainly related to COVID19 outcomes too.
But, I have already partly ‘dealt with’ one of those missing factors – Age. Because my data is vaccination rate in the over 65s, if different countries have different proportions of their populations over 65, then that should not affect my correlation. Had I just had access to total vaccination rates in countries, different age profiles in those countries would have mattered.
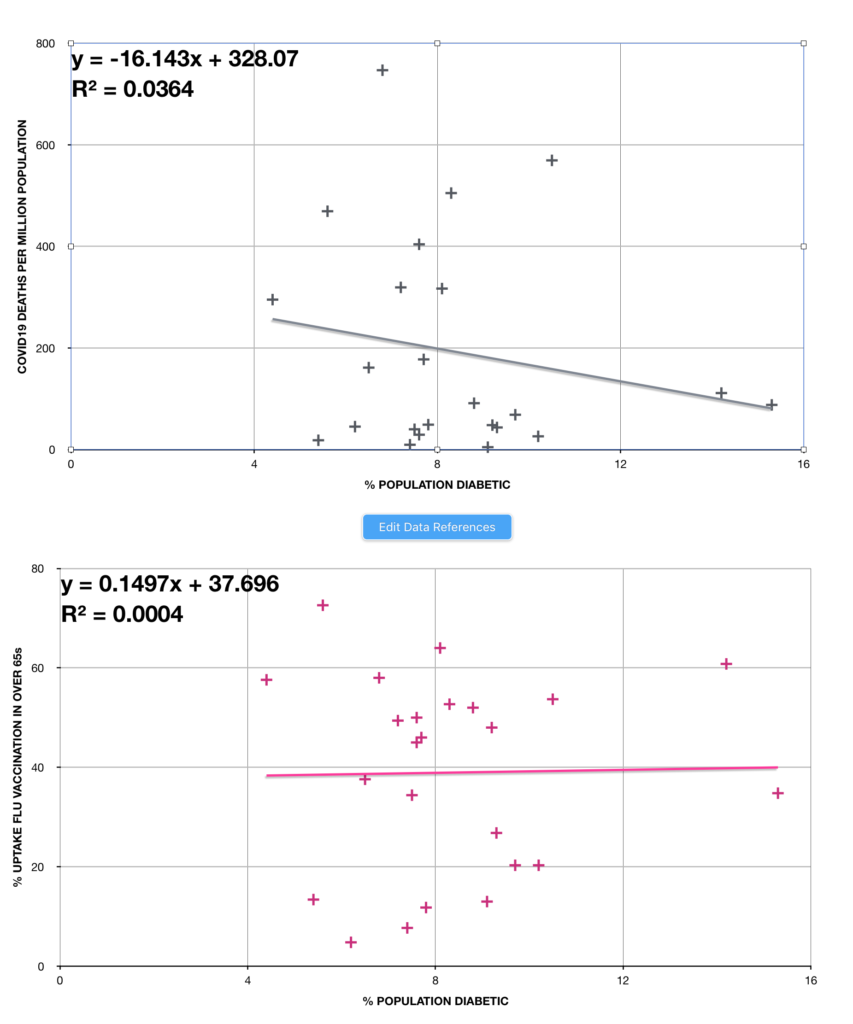
But there are other possible factors other than age. Prevalence of Type 2 diabetes (T2DM) is one. Luckily I can access data for 24 of the 25 countries on the prevalence of T2DM. I have then plotted these rates against both vaccination rates and COVID19 death rates. If this is one of my hidden factors, then I would expect to see correlations in both of these diagrams. From the graphs (attached) you can see neither has a correlation ‘strong’ enough to be of interest (both R^2 are much less than 0.5).
There are other possible factors and if I can access obesity and heart disease data for these countries i can perform a similar analysis.
Just a point of perspective here. Even if the correlation between influenza vaccine uptake and COVID19 death rates proves robust against other confounding factors, influenza in the long run will still probably kill more over 65s than coronavirus infections. Protecting against the former even if it may increase the risk to the latter may still be better choice for the population.