Post on Facebook, 11 April 2020
As many of you know, I am a bit of a geek when it comes to
data, numbers, scientific studies and the like. It is probably of no surprise therefore that I have been ferreting away at many of the papers and data sources with regard the current COVID-19 crisis.
I have a lot to say on the subject, based on data and science, and will probably share some of that on social media over the coming days. Be warned, it is controversial but I will say once again, based on data and science.
I thought that I would start though with non-controversial territory and that is the website of the Office of National Statistics (ONS). I have been following the page of ‘Deaths’ on this website for a number of weeks now and I believe there is huge value in sharing some of the data from this source, not least because it gives a point of comparison with the COVID-19 death data that we are exposed to in the media.
It is all about perspective. If you don’t want to read the detail below let me just summarise two data points: In the week ending 27 March 2020, 11,141 people died in England and Wales; of these 539 had COVID-19 listed on their death certificate. In the three months to the end of March, over 150,000 people have died in England and Wales.
I shall try to make the points here with minimal interpretation thereby making it a statement of reported data rather than opinion.
NOTES TO START:
1. The latest death data on the ONS website is for week ending 27 March, or Week 13 of the 2020 accounting year. Whilst this might seem like ‘old’ data as we are already at the 12 April, the ONS wait eleven days before compiling week end data to allow for the lag between actual date of death and date of registration of that death. To paraphrase that, it is assumed that eleven days beyond the 27 March most of the deaths that occurred up to 27 March have been registered. Because there may still be a small number of deaths that occurred up to 27 March but had not yet been registered eleven days after that date, the data in the ONS report is therefore termed ‘provisional’.
2. Unusually, and in light of the COVID-19 situation, the ONS are also providing provisional data up to 1 April in this same report. This will be ‘more provisional’ as it allows four fewer days for registration of deaths.
3. On 5 March 2020 COVID-19 was listed as a notifiable disease in the UK (and SARS-CoV2 a notifiable agent of disease). This means that if COVID-19 is present, or suspected to be present, at time of death it must be recorded on the death certificate. Two things to note here. First that COVID-19 is the disease; SARS Cov-2 is the coronavirus. Secondly a patient who dies with (say) end-stage cancer but also has COVID-19 at time of death will have COVID-19 listed on the death certificate and therefore will also be included in the COVID-19 mortality data. It then becomes unclear if the patient died ‘of’ or ‘with’ COVID-19 but they will be recorded in the number of COVID-19 deaths in the relevant period. In epidemiology of infection this is known as ‘case inflation’.
4. A doctor can certify involvement of COVID-19 based on symptoms and clinical findings – a positive test result is not required.
5. The ONS data applies to England and Wales. Scotland and Northern Ireland have separate reporting.
6. The daily COVID-19 death data released in the media is NHS data from hospital deaths alone; the ONS data is based on all deaths, not just those in hospitals. The data published by ONS is therefore more accurate but has the eleven day lag before being published; the NHS data is less accurate but is more timely as it is produced the day after the day to which the data refers.
7. The nature of transmission of SARS-CoV2 means that the effect of COVID-19 in the data for future weeks cannot be linearly extrapolated from the data to date.
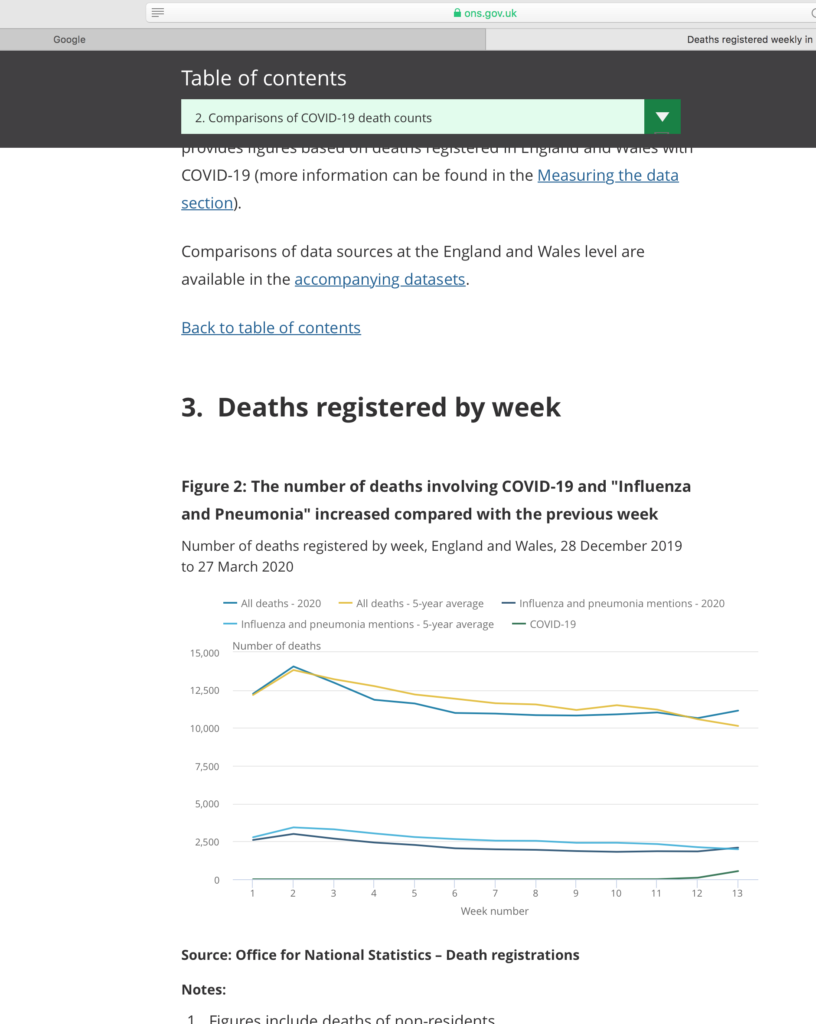
SALIENT POINTS OF THE WEEK ENDING 27 MARCH DATA
1. In Week 13, 11,141 people died. This is 496 more than the previous week (w/e 20 March) and 1,011 more than the five-year average. The total in this week equates to an average of around 1,600 deaths per day.
2. Of the Week 13 total, 539 deaths had COVID-19 listed at time of death.
3. In the 13 weeks from the start of the 2020 accounting period to March 27, 150,047 people have died in England and Wales. This is 3,350 fewer than the five year average.
4. The peak weekly total of deaths in this period was Week 2 (w/e 10 January), 14,000 deaths.
5. If the estimated data for 1 April is included, a total of 1,639 deaths listing COVID-19 had occurred since the start of 2020.
6. Of deaths involving COVID-19 in Week 13, 93% occurred in hospitals.
7. In Week 13, 18.8% of all deaths mentioned “pneumonia or influenza, COVID-19 or both” . In the five year average, for Week 13, 19.6% of all deaths mentioned “pneumonia or influenza”.
8. In Week 13, 5.5% (99 out of 1,800) deaths in the 65-74 age group were listed with COVID-19; 4.2% (188 out of 4, 470) deaths in the 85 years and over age group were listed with COVID-19.
9. There were an estimated 23,200 excess winter deaths in England and Wales in the 2018-19 winter period and that was the lowest number of excess deaths since 2013-14.
COMMENTS RECEIVED AND REPLIES:
Comment
Are you going to run Covid-19 against “normal” flu rates? I keep reminding people it is a nasty version of flu. It would put things into proportion. This is not to diminish the seriousness of what is happening but……
Reply:
I would so love to be able to perform that analysis. I fear though that the data will never be known simply because COVID-19 is notifiable but seasonal flu is not. So effectively COVID-19 ‘trumps’ flu on any death certificate and so fatalities from flu in this season will not be known. The closest we can get to that is the datum of cases of “pneumonia and influenza” in five year average versus cases of “pneumonia, influenza and COVID-19” in 2019-20 which will not be know until the end of the season and all the data is in. In the Week 13 ONS data 18.8% versus 19.6% so, so far, we are down on cases. I think one of the perception issues is that people often do not realise how serious true flu can be and so I agree, in terms of mortality, seasonal flu and SARS-CoV2 may well be similar.
Actually, I have just re-looked at the data and yes, there is something. In Week 13 there were 2,090 influenza and pneumonia mentions compared to 539 COVID-19 mentions amongst causes of death. As the numbers of COVID-19 deaths rise in later weeks’ data it will exceed the 2000 of pneumonia and influenza cases but will there be double counting? Many/most of the COVID-19 deaths will involve flu/pneumonia symptoms. There is also the case inflation issue that COVID-19 deaths will include a high number of patients who die with the infection but not from the infection. I fear it will be an apples with pears sort of comparison….
Good question and of course the one a statistician wants to avoid answering by saying “let the data speak for itself”. But as you say, unless you are comfortable with numbers, that is not going to happen.
The first part of your question: does the data suggest that the pandemic is better or worse than we are led to believe? I have no evidence to suggest that the number of deaths being reported is wrong per se. BUT, there is a huge point about notifiable disease. The death figures we see every day are, to be accurate, “deaths of individuals who at time of death have, or from clinical assessment it is reasonable to assume they have, COVID-19”. This does not mean that they died OF COVID-19. As far as I am aware there is no data that allows us to un-pick how many of those whose death was solely due to COVID-19, those whose death was accelerated by COVID-19 and those whose death was independent of the fact they were infected with COVID-19. Push me to an answer and I would say the data as published makes the pandemic look worse than it actually is because it includes deaths that are not attributable to COVID-19 (the patient by chance had COVID-19) and deaths accelerated by COVID-19 but might have occurred anyway. I also make the point that in the time that there have been 10,000 reported deaths (to date) with COVID-19 (notice I use ‘with’ rather than ‘of’) there have been around 175,000 total deaths in England and Wales. I think this is an important perspective.
The second part of your question: are the figures worse or better than an average year? Strictly there can be no answer to that until we have the full year data. But, if you are going to push me for an answer, by the end of March – the period for which I have data – no, it is no worse. Remember from the data there were 23,000 ‘extra’ winter deaths in 2018-19; there are 10,000 COVID-19 associated deaths so far. But the fact that the data is 11 days out of date and viral spread is not linear (the rate of increase, increases) means that picture will change with each new week’s data.
Allow me to make one more point (regrettably based on statistics again) regarding the importance of population testing. We critically need to know how many of the general population have already been exposed to SARS-CoV2. If, as some guesstimates suggest, it could be as high as half the population that would make the answer to the second part of your question a much more confident ‘no’, its no worse than a normal year. [That is a simple argument of ratios: If half of all people have or have had COVID-19, then at least half (and probably a higher percentage) of those people who die would also expect to have it. So if the daily deaths with COVID-19 are around half of the average number of deaths (which is the case at the moment) then we are not in anything more serious than an average year.] If only (say) five percent of the population have COVID-19 then the answer to your question is almost a certain ‘yes’ this is something far worse than a normal year. Although that does not mean that total population deaths will be higher as people being at home reduces ‘out of the home deaths’. The extra COVID-19 deaths would have to be offset against these reduced deaths from other causes.
Comment:
This is taking into account the fact that social distancing has (hopefully) slowed down the spread of the virus. We won’t ever know the reality of how this would have panned out with no intervention x
Whilst I appreciate the facts, do the circumstances make “normal” deaths “abnormal” as we are all in lockdown?
Reply:
The data to Week 13 (to 27 March) won’t really have any effect of lockdown as that only happened from the evening of 23 March. What will be interesting is data from (probably) week 15 onwards as by then lockdown will have been in place for at least the known incubation period of SARS-CoV2.
I think the concept of normal deaths still holds in lockdown. People with CHD will still have heart attacks; people with CVD will still have strokes; people with end stage cancer will still succumb. There will be fewer road deaths (for example) but equally lockdown will lead to more deaths in that the stress of social isolation will exacerbate conditions which are correlated to anxiety, fear, worry. The key comparison has to be, are we getting more deaths in (say) Week 13 in a Coronavirus year than we would have had in a non Coronavirus year (the answer for Week 13 is a definite no – no more deaths than normal). But as we get more data for following weeks we can answer that key question. Nothing in the data suggests either way at the moment.
Comment:
Your posts on this are really interesting. Thank you for highlighting the statistics, there is a lot to take in. A thought I’d like to add is that surely the risk of catching any infectious disease was likely to start reducing for many people when we first took on board the dangers of COVID-19, in addition to the effect that any measures we took had on the spread of the virus. As I look back, by the end of February, social behaviours had started to change, with care being taken to avoid infection. I cannot speak for everyone of course, but at the centre where I work there were firm measures in place by the first week of March to improve hygiene practices and step up surface cleaning and hand washing, with staff and clients expected to be vigilant and act responsibly to avoid transmission. Compared to previous years, I wonder then if the spread of other diseases started reducing in the wider community some weeks before lockdown, perhaps providing some protection to vulnerable people and thus impacting the number of “normal” deaths recorded? I’m no expert, but would be interested to know your thoughts. Completely agree that mental health sadly is going to be one of the casualties
Reply:
An interesting point. Yes, I am sure that the measures we started to take from February will certainly have impacted the spread of the virus and indeed the spread of any infectious diseases in the same period.
Normal deaths will perhaps reduce a little therefore but I would suggest minimally: Most deaths in recent years are from chronic non-communicable diseases (heart disease, cancer, cerebrovascular disease, type two diabetes, suicide, incorrect medication taking etc) rather than infectious diseases, so the measures you describe will have little impact on ‘normal’ death rates.
The other thing to bear in mind with COVID-19 is that it has a relatively low mortality rate – just getting it, is far from a death sentence. The death data I examine in this post are a couple of stages-on from simple measures of reducing its spread. First you need to be exposed to SARS CoV2; then you need to develop COVID-19; then you have to develop symptoms of COVID-19; then you have to develop severe symptoms; then you have to enter life threatening symptoms and then eventually die to appear in the death data. Only the first stage of that chain (being exposed to the virus) is controlled by the measures you describe. The rest of the chain seems more correlated to the metabolic health of the individual rather than lockdown, hygiene measures. The same non-communicable diseases that are the majority of ‘normal’ deaths are then the determinant of COVID-19 deaths.