Facebook Post 13 April:
I am very heartened with the level of engagement generated by my post yesterday about UK death data. It is very refreshing how many of you took the time to thank, question, explore some of the points. In fact, I am conscious that I have not replied to all of you yet – but I will.
Allow me to continue the theme. This time with information that is more up to date. My death data relied on ONS numbers that currently are only estimates to 1 April, making the data 11 days ‘out of date’. Virus spread is exponential which means the rate at which it increases, in itself increases: Eleven days is a long time in an exponential world!
So in this piece I shall summarise some data from scientific papers published in April that I think are of interest. My reason to share this with you is that I do not feel that the headline-motivated sound-bites we get from mainstream media are giving us balanced reporting. The lack of context or balance in the data we are given by the media are contributing to a pandemic of fear that might be of longer term harm to the population than the actual viral pandemic.
Yes, there will be numbers in this summary, but I will endeavour to stop the percentages being rampant! Where appropriate, I date stamp the observations to give a sense of currency.
1. A study published 5 April compared the risk of mortality to COVID-19 to the risk of a fatal car accident from daily driving. In Germany – the data source with the lowest COVID-19 mortality – the death rate for under 65s was equivalent to the risk of a fatal car accident for those who drive just 9 miles every day. In New York City (the data source with the highest mortality), the corresponding risk for under 65s is equivalent to that of someone having a fatal car accident who drives 400 miles every day.
2. A key problem with all estimates of the death rate for COVID-19 is that unless you know the total number of people infected, your estimate of the death rate (total deaths divided by total number of people infected) will be inaccurate. A paper published on 8 April tried to address this. Using data from population testing in one county in the States, they showed that whilst the official number of cases in the U.S. at that date was 400,000, the real number would actually be somewhere between 2.6 million and 10 million. This hugely impacts the estimate of how deadly the virus is. If the 10 million figure is accurate the death rate from COVID-19 is no higher than seasonal flu. If we use this to recalculate the risk described in point 1, this means the risk in NYC is actually equivalent to a fatal road accident from daily driving 64 miles or 16 miles (rather than 400) depending on which estimate is used.
3. A study at Vienna university published on 7 April showed that the age profile of deaths from COVID-19 was statistically no different from all cause mortality. In plain speak, if for example 40% of all deaths are of people aged over 85 (approximately the case in the U.K.) in a normal time period, then 40% of COVID-19 deaths will also be in the over 85s.
4. Data from U.S., Spain, Switzerland and Germany, published on 8 April, suggested that the peak of infection had passed in the three European countries and the new case rate was levelling-off in the U.S.. From the population testing for the virus in those countries, the number of new cases of exposure to the virus each day were levelling off or reducing.
5. A study published in the BMJ on 2 April showed that in China, 80 per cent of new cases of COVID-19 are completely asymptomatic. A related study showed that even in the 70-79 age group 60% of those infected were completely asymptomatic.
6. Different countries have adopted different strategies. Of most interest within the Scandic countries is that Sweden has not adopted total lockdown but its neighbours have. The rates of infection and mortality rates in Sweden are not (currently) statistically higher than its neighbours which questions whether lockdown is really an effective strategy. As the lead researcher describes in one of the papers discussing this “…lockdown is going to bankrupt all of us and our descendants and is unlikely at this point to slow or halt viral circulation as the genie is out of the bottle. The equation is: is the economic meltdown a price worth paying to halt or delay what is already among us?”
7. Many studies show the very high correlation between pre-existing metabolic conditions and severity of COVID-19 symptoms. One study (based on data from China) shows that having type II diabetes makes you ten times more likely to have severe symptoms or die from COVID-19. The presence of metabolic syndrome, insulin resistance and conditions correlated with chronic systemic inflammation are far more significant predictors of COVID-19 severity than age.
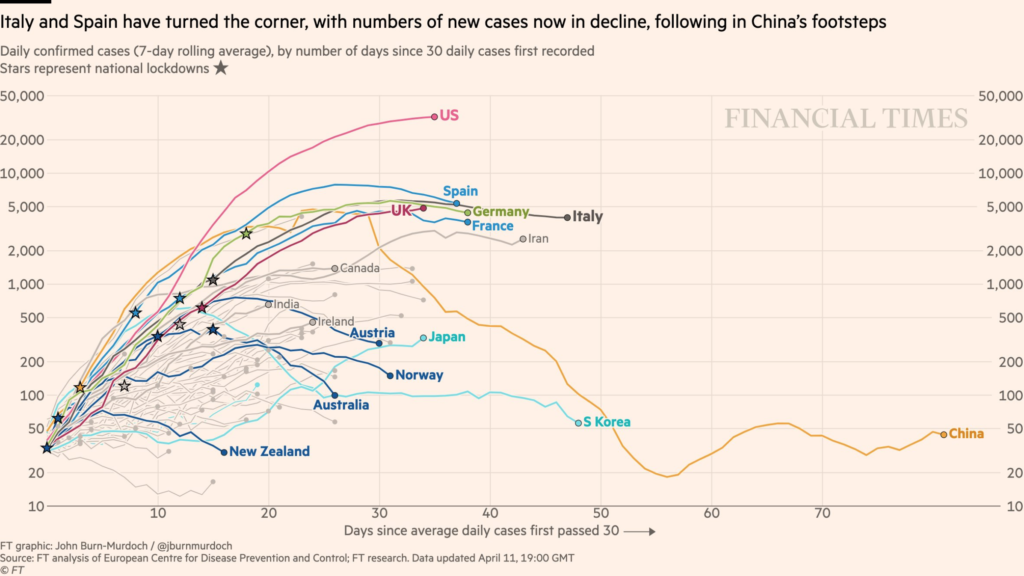
8. The graph (F.T. 11 April) attached to this post, shows that in most countries the reporting of new cases of COVID-19 has peaked or is about to (even in the U.K.). Not reported from this data, but deducible from the graph, is that the peak of the curves for each country that has implemented lockdown occurs at different points relative to when lockdown started. The graph does not evidence that countries who have not implemented lockdown have taken any longer to reach peak number of cases. This does not necessarily indicate that lockdown fails as a strategy but probably shows that in countries where it has been implemented, it has been implemented too late to have significant impact.