Posted 25 April 2020
WARNING: EXTREME GEEK ALERT!
What follows is not for the weak, infirm, or of a nervous disposition when it comes to maths.
Click the Previous or Next buttons if at all unsure!
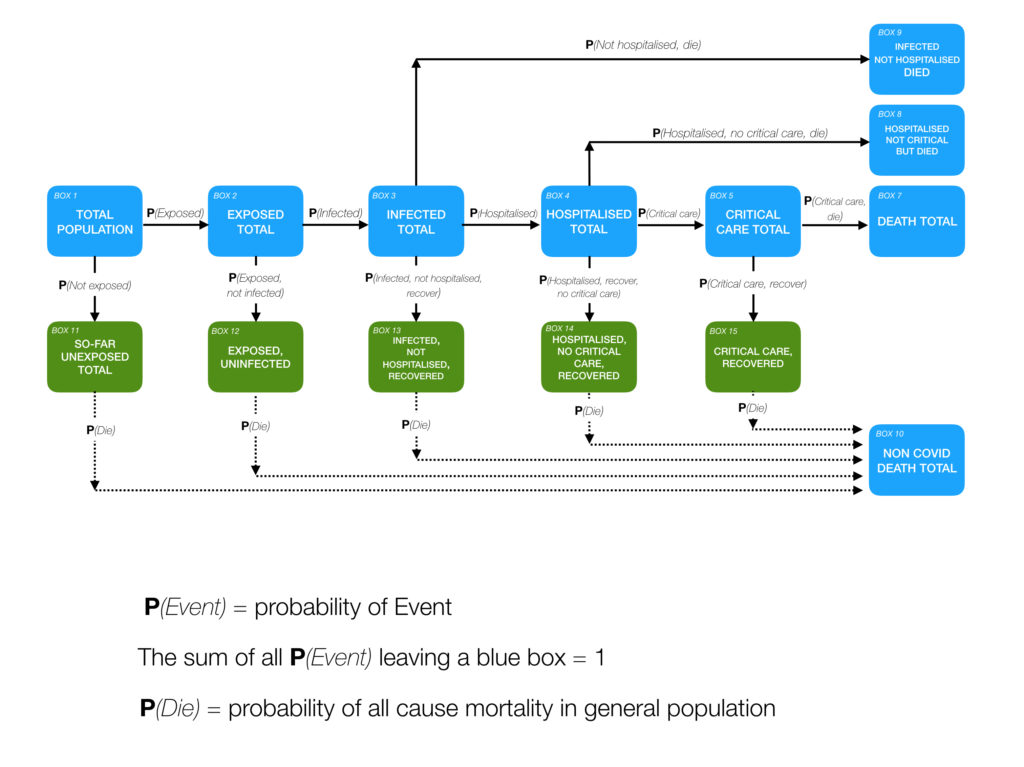
The diagram is a flow diagram. We are all in one of theses boxes. If you are reading this, you cannot be in some of those boxes (for example Boxes 7, 8 ,9 and 10 because if you were, you would be dead). You are also unlikely to be in Box 5 as you would be in critical care and not reading this!
This is a flow diagram. The things that are flowing through this diagram are you and me!
Before coronavirus came along we were all in Box 1 (TOTAL POPULATION). The probability that you moved to Box 2 is the thing I have labelled P(Exposed) on the arrow that connects those two boxes. Putting it in fuller English. P(Exposed) is the probability that you have been exposed to the virus. Even if you are now in Box 13 (say) you would still need to have passed through Box 2 to get there.
The probably that you are now in Box 11 (i.e. you have only moved from Box 1 to Box 11) is P(Not exposed) again marked on the arrow that connects those boxes. In a fuller sentence, P(Not exposed) is the probability that you have not yet been exposed to the virus.
As you have either been exposed or not exposed (there is no other option – you must either be in Box 11 or be in or have passed through Box 2 ) the sum of these two probabilities, namely P(Exposed) and P(Not exposed), must equal 1.
If you are in Box 3 you must have arrived in Box 2 first and then passed into Box 3 (remember it is a flow diagram from left to right). The probability of that happening (being in Box 2 and then moving onto Box 3) is P(Infected) again the label that is attached to the arrow for that journey. To put that in a full sentence: P(infected) is the probability that having been exposed you then develop the infection.
The other option from Box 2 is ending-up in Box 12 – exposed but not infected. The probability of moving to here from Box 2 is P(Exposed, Not infected). So the comma within the bracket you would read as an ‘and’ or a ‘but’).
The total probability of starting in Box 1 (as well all did) and ending in Box 12 is the product (multiplication) of the probabilities attached to the arrows to get you to the destination box. So, the combined probability of ending up in Box 12 is P(Exposed) X P(Exposed, not infected). Putting that in a fuller sentence: The probability that you were exposed but remained uninfected is the probability of being exposed multiplied the probability of once exposed, remaining uninfected.
Just to further the example, and by jumping to the end of that row: The probability of moving from Box 5 to Box 6 (being in Critical Care and then dying) is P(Critical care, die). The combined probability of someone in Box 1 (The Total Population) ending in Box 6 (Dying in hospital having received critical care) is the product of all the probabilities on the arrows between Box 1 and Box 6.
I have abbreviated some of the Box descriptions, but all of the events leading to that Box must have happened. For example to be in Box 15 you must have been exposed, infected, hospitalised, given critical care and recovered.
So why is this useful?
Well tantalisingly we have some estimates of the numbers for some of the boxes. We also have estimates for the sums of some of the boxes. For example, the NHS daily published positive test figures (expressed as a cumulative total) gives us an estimate of the number of people who are in or who have been in Box 4 (some will have moved to other boxes). The ONS total death figures give us a combined total of Boxes 6-9.
We have estimates of some of the probabilities and sometimes estimates of some of the probabilities combined. Hospital records can give us estimates of, for example, P(Hospitalised, critical care) on the arrow between Boxes 4 and 5. The CFR is a combination of all the probabilities of dying once someone has reached Box 4.
We want to know some of the totals in some of the boxes. We want to know some of the probabilities. It is tantalising because inevitably what we have and what we want never perfectly align.
P(Exposed) is key. If we knew how many people have already been exposed to the virus that would tell us a lot about the risks of easing lockdown.
Another key one to estimate is P(Hospitalised) between Box 3 and Box 4 (it is actually the probability of being hospitalised once infected). If this is known, it allows a back calculation of total number of infections (Box 3) from Box 4 (the NHS reported total cases entering hospital).
Here is the clever thought, what if we sampled the population robustly, maybe based on records in the census? We then determine the following:
- If the selected person is not in hospital, perform the antibody test to see if they are positive
- or, we note if the person is still in hospital as a confirmed COVID case.
We then state the percentage of our sample who are either of the above and call that S.
Using the flow chart (and a lot of geekiness) to derive the formula:
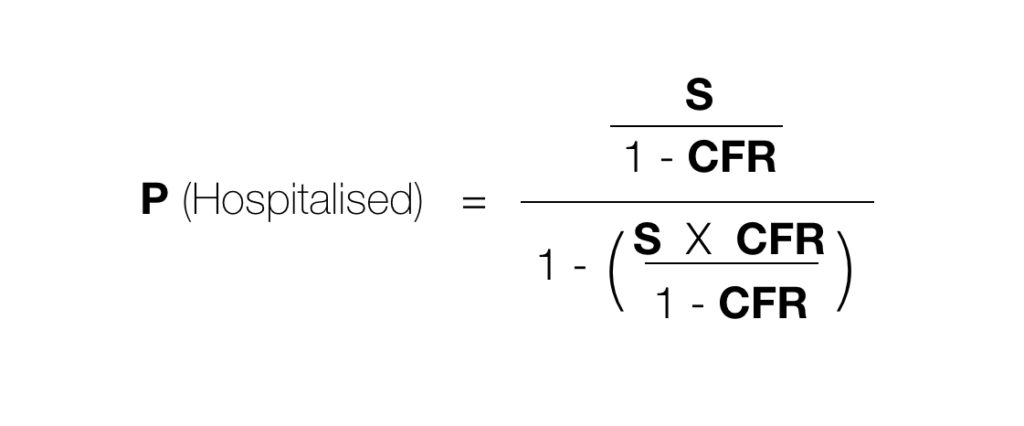
where:
S is as defined above, the proportion of the sample with the antibody or a current COVID case in hospital, and
CFR is the case fatality rate.
Once P(Hospitalised) is known we can estimate more properly our IFR:
IFR = CFR/P(Hospitalised)
and from that the true percentage of the population that has been infected.
Simples!!!