Posted 2 May 2020
WHAT IS THE CHANCE OF YOU DYING OF COVID-19?
Well, I have done the sums – that bit was quite quick. Mulling them over has been a day-long process!
The tables are attached to this post but…..wait for it…..they need some explanation.
1. This is based on the Week 16 figures published by the ONS.
2. I have divided the data into 5 year age intervals 35-39, 40-44, 45-49 and so on as that is how the ONS divide their data. I have not included ages below 35 as the deaths in these age groups are very low.
3. This is likely to be the peak week of COVID deaths. If it is not, Week 17 will almost certainly claim the title. We will have a clearer idea next week when Week 17 data are published. Either way, the death rates in the tables are likely to be the worst or near worst case scenario.
4. I compare two death rates – death rate due to COVID-19 and ‘baseline’ death rate, that is death to causes other than COVID-19.
5. The rates are expressed as deaths per 100,000 within that age group.
6. The calculations are derived using Bayesian statistics. I will do a video tomorrow to explain.
The data is not ‘clean’. As I have described in earlier posts there is a ‘gap’ in the data. Normally 10,500 or so people die in an average Week 16. This year, 22,300 people died. The ‘excess’ you would expect to be the COVID deaths, but COVID registration only accounts for 8,750 deaths. So there are 3,000 ish extra deaths in Week 16 that are not registered as COVID deaths.
This is a puzzle. Are more people dying of other reasons or are the ‘gap’ 3,000 really COVID deaths but it was not diagnosed at time of death? The deaths were registered as deaths but just not as COVID deaths.
How we interpret the ‘gap’ makes a difference to COVID/non-COVID death rates, particularly in older age groups. The simple ‘gap adjustment’ is to assume all excess deaths over an average week must be due to COVID-19.
So, I have provided multiple columns in the tables.
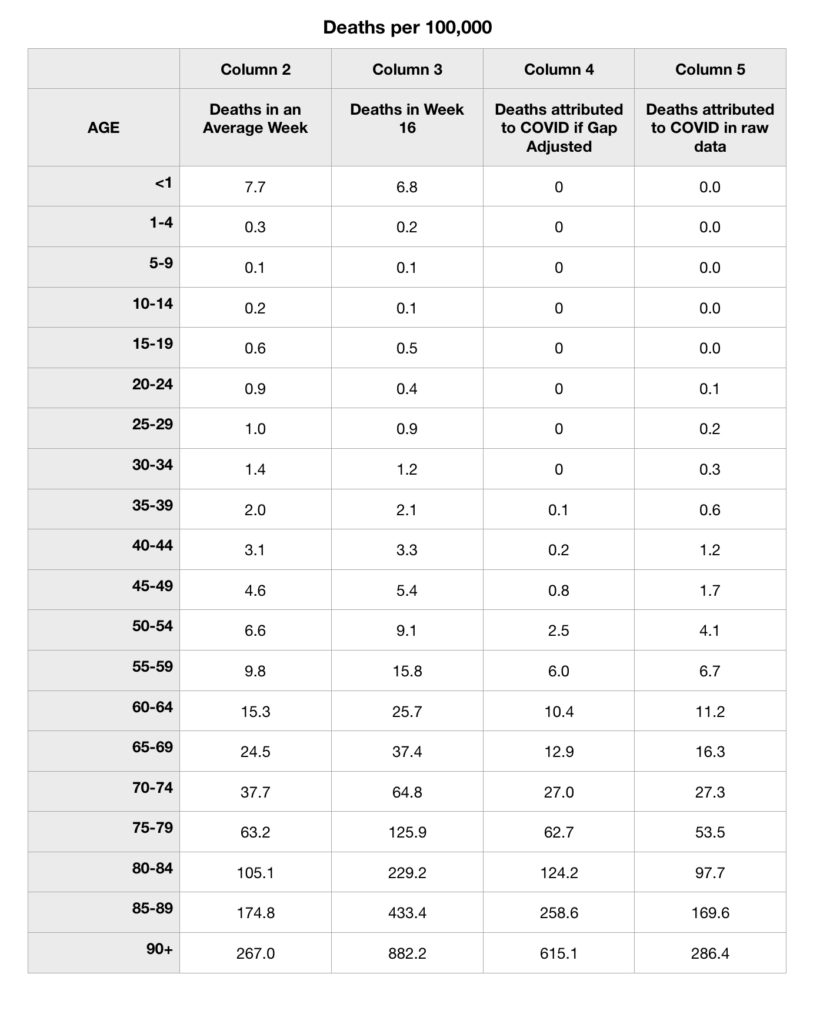
Column 1: Age interval
Column 2: The number of people in that age group who would die in a ‘normal’ week.
Column 3: The number of people in that age group who died in Week 16 2020
Column 4: The excess deaths attributed to COVID if we assume that all excess deaths should be attributed to COVID (effectively adjusting for the gap). This number is Column 3 minus column 2
Column 4: The actual number of deaths in the age group attributed to COVID in the raw (non gap adjusted) data.
EXAMPLE:
If you are 53 years old, according to the table 6.6 per 100,000 people die in this age group each week.
In week 16 2020, 9.1 per 100,000 died in this age group.
In the gap adjusted data, the excess, 2.5 per 100,000 would be attributed to COVID.
In the actual data 4.1 per 100,000 were attributed to COVID-19; the remaining 5.0 per 100,000 were not.
Either way, in Week 16 a 50-54 year old was still more likely to die of causes other than COVID-19