Posted 2 May 2020
Today is a numbers day. I will do a full post later in the day (probably with a video) but let me give a snapshot of what I am doing with the numbers. My analysis is effectively seeking an answer to a question that has probably been somewhere in your thoughts over the last few months:
“What are my chances of dying of COVID?”.
Statistical analysis often has to strip emotions from questions. I shall do the same here. You add the emotion back at the end.
The latest figures from the ONS for deaths in Week 16 (week ending 17 April) are possibly important in two regards:
– They may represent the ‘peak’ week in COVID deaths; if they do not, Week 17 probably has that dubious accolade. We will know the answer for sure next Tuesday or the Tuesday after when week 17 and week 18 data are published.
– Secondly, Week 16 data are probably the first week when a more accurate proportion of deaths in Care Homes have been attributed to COVID-19. As COVID-19 deaths are definitely age-correlated, the omission of coronavirus related deaths in Care Homes in previous weeks’ data will have skewed a true analysis of age and COVID-19 deaths up to this point.
The ONS data on deaths is stratified in 5 year age intervals, 5-9 years old, 10-14 years old, 15-19 years old and so on. I am in the 50-54 age interval. The analysis following sticks to that age group (..it’s all about me…) but I will do a full post later doing the same analysis for all age groups (….making it all about you and no longer all about me…).
The analysis is geeky so let me put some headlines first:
- In week 16, the risk of someone in my age group dying was 0.000091 compared to 0.000066 in a ‘normal’ week.
- If someone in my age group died in Week 16, they were more likely to have died of something other than COVID-19. The data allows me to estimate the relative risk of me dying of non COVID reasons to be in the range 1.25 to 2.63.
[To put that last sentence in plainer English, whatever the true number is within that range it would complete the sentence:
“In Week 16, I was <number> times more likely to die of something other than COVID-19”]
THE ANALYSIS:
I have three data files from ONS:
A: Deaths data for Week 16 2020.
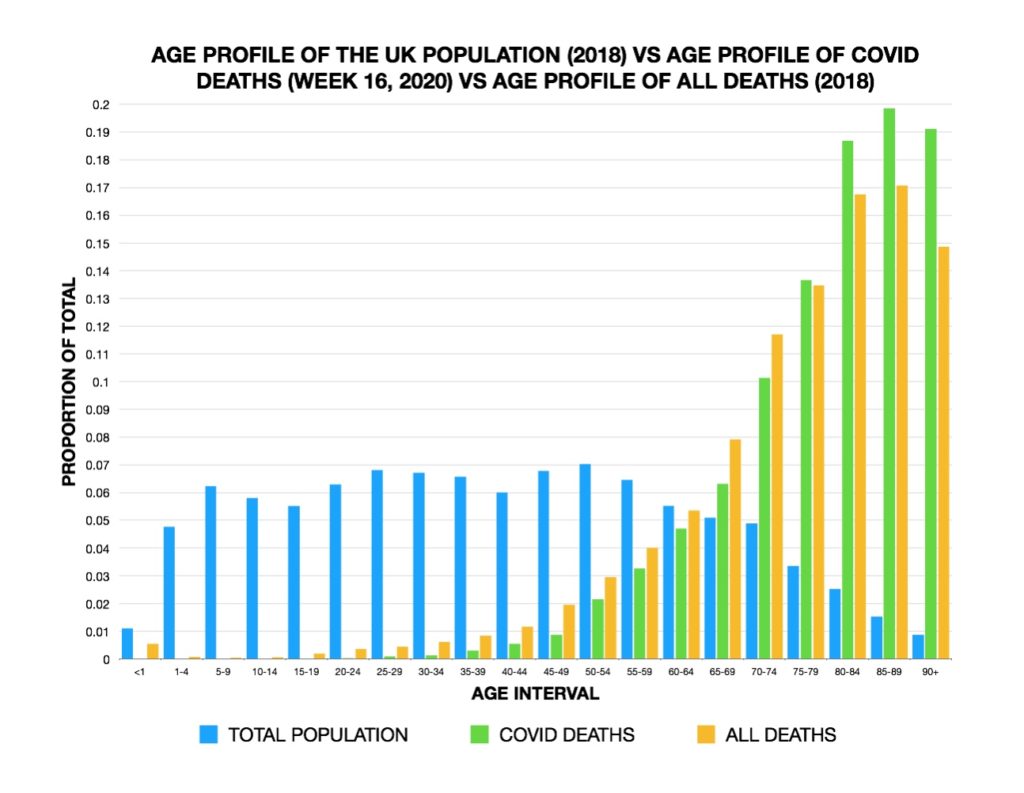
B: Data for all deaths in 2018.
C: Age profile data on the total UK population for 2018.
Data set A tells me how many people in my age group died in Week 16 2020, both with COVID on the death certificate and without COVID on the death certificate. Data set B tells me how many 50-54 year olds die on an ‘average’ non-COVID week. Data set C tells me what proportion of the total population my age group represents.
So here are the results.
1. On an average non-COVID week there are 10,497 deaths in the UK.
2. In Week 16 of 2020, there were 22,351 deaths.
3. Therefore, in Week 16 of this year there was a 213% increase in the chance of us dying. DON’T PANIC at this point.
4. The overall probability of a UK resident dying in a typical non COVID week is 0.000158. Or, 15.8 in 100,000. That is how many of us die (averaged over all age groups) each week here in the U.K. in a normal week. That figure became 33.7 in 100,000 in Week 16, or 0.000337. Remember three things:
– This is likely to have been the worst week of COVID (or if not, second worst).
– Also, consider perspective: buying two lottery tickets may double your chance of winning the jackpot (a 200% increase) but your chances of winning are still small.
– This is very heavily skewed to those aged over 80 (I will explain the attached graph in the later post) – though if you are over 80 and reading this, that is not something that will make you feel better about the data. If you are under 80 it should.
5. In an average week, 310 people in my age group die. This is a chance of dying of 0.000066, or 6.6 in every 100,000.
6. In Week 16, 428 people in my age group died. That is a chance of dying of 0.000091 or 9.1 in every 100,000.
7. Week 16 increased the probability of someone in my age group dying by 2.5 in every 100,000 or 0.000025. This equates to 118 excess deaths in my age group in that week. There are currently 4,680,000 UK residents in my age group.
8. In Week 16, 190 of the deaths in my age group had COVID-19 on their death certificate. Therefore, 238 of the 428 deaths in my age group were not attributed to COVID. This means that in my age group, I was 1.25 times more likely to die of something else other than of COVID-19 even in Week 16.
9. An interesting ‘gap’ in the numbers here: On an average week 310 people in my age group die (so these must be non COVID deaths); in Week 16 only 238 in my age group died of non COVID causes. If heart disease, diabetes, stroke, cancer etc are typical causes of these non-COVID deaths, are these illnesses causing fewer deaths in my age group in Week 16 than an average week, and if so why? Or, are we seeing a measurable drop in deaths due to ‘out of the home’ deaths in my age group as we are now in lockdown and this explains the gap? Or are a significant proportion of deaths in my age group attributed to COVID, actually deaths for the underlying reasons listed above, but their data has been ‘moved’ into the COVID group because COVID-19 infection was measured (or suspected) at time of death?
If I assume the extreme of that last reason above (i.e. there should have been 310 non COVID heart attack, cancer etc deaths in Week 16 so it is only deaths above that that are truly due to COVID) then 118 deaths in my age group due to COVID rather than 190. So 118 of a total 428 deaths in my age group truly caused by COVID, meaning I am 263% more likely to die of something other than COVID-19 in Week 16. The true ratio of non COVID to COVID deaths in my age group therefore probably lies somewhere between 1.25 (from paragraph 8) and 2.63.