Posted 18 April 2020
Today one headline I saw was an upwards revision of the Wuhan COVID-19 death toll by 50 per cent. Scanning the article it seems that this was due to overwhelmed healthcare systems in the early stages under-attributing deaths to the viral infection. This mirrors, I think, the upcoming spike we will see here in the UK because of more complete COVID-19 recording in Care Homes.
This perfectly demonstrates how we have an ever-changing data terrain whilst we are in a crisis such as this and only once we we are in the safe territory of hindsight, we will begin to get complete pictures for onward lesson-learning.
Today my focus, using the data terrain we have, is on co-morbidities.
Lots of studies are now emerging looking at the chronic and acute pre-existing conditions presented by COVID-19 patients in the healthcare systems and how those conditions correlate to severity of COVID-19 outcomes.
So these studies are trying to answer questions like “how does diabetes affect the likelihood you will have a severe response to COVID-19?”
Theses studies are looking at conditions such as hypertension, type II diabetes and obesity. Before I delve into the studies, let me make some general points about the data:
1. The conditions that are recorded are most likely to be those that are most relevant to the critical care of the patient. So hypertension, respiratory disorders and heart disease are good examples of these. Data on other conditions, not likely to be providing insights into the care pathway for that patient are unlikely to be recorded. But, often, to understand the underlying metabolic health of a patient, it is these other conditions and associated measures that are useful. Blood tests such as those for inflammatory markers and HbA1c measuring insulin function, presence of other conditions such as gout and oedema (both co-markers of poor metabolic health) are examples of these. Recording of these test data and symptoms are unlikely in critical care situations so deductions of true metabolic health are trickier from the COVID-19 data.
2. Echoing the point I made at the start of the piece, hospitals overwhelmed by critical care cases will not have the luxury of complete recording of all aspects of patient data or will yet have had time to process that data. Co-morbidiity data is therefore more likely to be from health care systems not overwhelmed at the time of patient presentation. Whether this skews the profile of co-morbities is yet to be seen.
3. When looking at the data from other countries an important counter-point to any co-morbidity data that could be relevant to COVID-19 is the prevalence of that co-morbidity in the general population of that country. For example, if we look at hypertension in COVID-19 cases in China, we need to know the level of hypertension in China in general before we make deductions of the relevance of that co-morbididty to COVID-19 outcome.
I now offer this remainder of this piece in two parts. I firstly summarise the results from five studies looking at links between co-morbidiites and COVID-19 outcomes. After that, I provide a bit more detail on each study, for those who like analysis and numbers!.
SUMMARY CONCLUSIONS
1. Many studies are looking at the links between how severely patients respond to COVID-19 and the prevalence of certain pre-existing medical conditions, termed co-morbidities.
2. The key co-morbidities looked at are: obesity, diabetes, hypertension, chronic obstructive pulmonary disease (COPD), coronary heart disease (CHD), cancer, renal disease, cerebrovascular disease (CBVD) and immunodeficiency.
3. The co-morbidites that are consistently or most strongly correlated with poor COVID-19 outcomes are obesity, diabetes, COPD and hypertension.
4. Although obesity, where is it measured in studies, is a strong predictor of severe outcome, it is not measured in most of the studies. This maybe because it does not directly change critical care pathway decisions in a hospital situation.
5. Some studies look at COVID-19 cases in hospitals and so show once a patient is hospitalised, how the risk of severe response increases with co-morbidities; others look at a broader sample of patients and so can assess how co-morbidites increase the risk of needing hospitalisation.
6. Ninety percent of patients who are hospitalised with COVID-19 have one or more of that list of co-morbidities.
The risk of severe COVID-19 outcomes in hospitalised patients non-linearly increases with more co-morbidities present in the patient (that is, having two co-morbidities more than doubles the risk).
7. For those patients who are hospitalised, having one co-morbidity increases the risk of severe response by 80 percent. Having those two or more co-morbidites, increases the risk by 260%.
8. For all cases pre-hospitalisation, having one or more co-morbities made hospitalisation 4 times more likely.
9. Those patients with diabetes have more severe pneumonia symptoms, more pathological lung damage and more uncontrolled immunological responses compared to those patients who do not have diabetes.
10. Critical Endpoint Cases (CECs) are termed cases that need ICU or mechanical ventilation or die. The risk factor for a case becoming a CEC is very dependent on co-morbities.
11. Having COPD increased the risk of CEC by a factor of 20 (twenty times more likely to reach CEC); diabetes by a factor of 4.4 (4.4 times more likely).
***** THE STUDIES *******
Study 1:
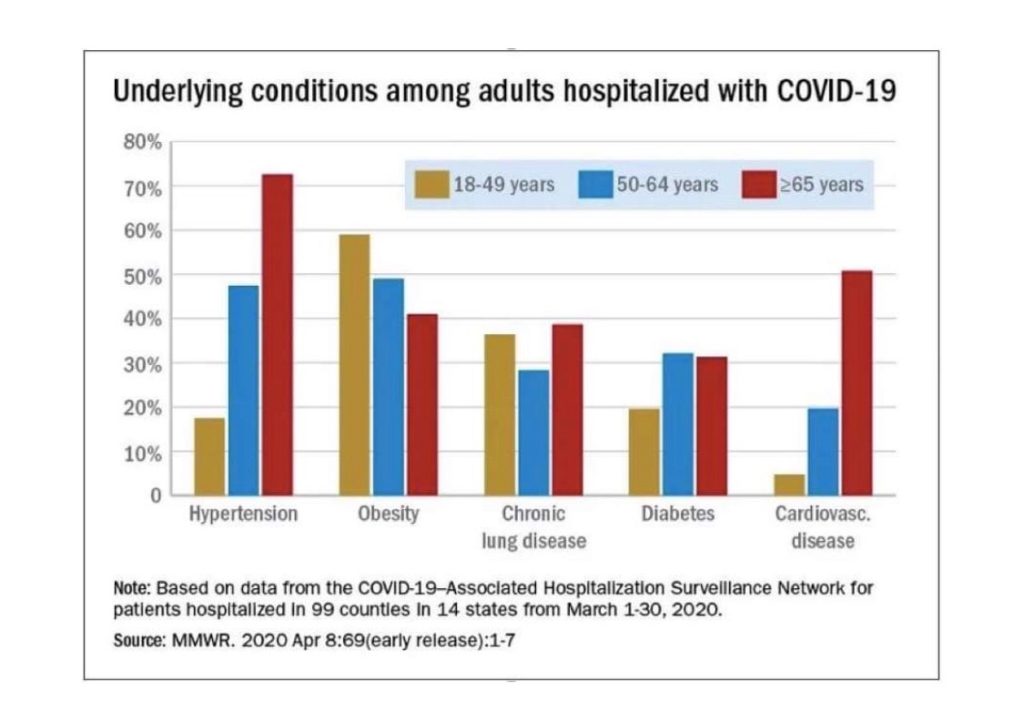
This was a study of hospitalisations with COVID-19 in 99 counties of the U.S. between 1 and 30 March 2020. The graph is the attached image. Five conditions on the horizontal axis. The vertical axis is the prevalence of those conditions in each of three age groups 18-49 year olds; 50-64 year olds and those over 65.
Just to check we are reading this the same way: Nearly 60 per cent of all 18-49 year olds admitted to hospital with COVID-19 symptoms were obese; over 70 per cent of all those over 65 admitted had hypertension; nearly half of all 50-64 year olds were obese or had hypertension.
If you add all five percentages for each of the colours, those totals come to more than 100%. The total for the 18-49 for example is around 140%. This means, on average, 18-49 year olds hospitalised with COVID-19 symptoms had 1.4 of these co-morbidities. Those averages are higher for the other age groups: in the oldest age group it is about 2.3.
Notice this is a study of hospitalisation rather than deaths.
In my pre-amble, I made the point that we need to know the prevalence of listed co-morbidities in the general population (in this case the U.S.) to make robust parallels that might apply to the U.K. So, for example, if we look at obesity in this data for 18-49 year olds (nearly 60%) it is key to know what is the prevalence of obesity in 18-49 year olds in those parts of the U.S. I do not have those data but obesity in the U.S. overall is 40% of adults; so the datum that 60% of 18-49 year olds hospitalised with COVID-19 symptoms were obese is probably a significant finding. That is, being obese in the 18-49 age group significantly increases your chance of serious COVID-19 outcome.
What is not presented in the graphs is the datum that 90% of admissions had one or more of the listed co-morbidities. My lack of familiarities with U.S. government websites means I am struggling to find the comparable data, but what I have found suggests that 75-80% of the general U.S. population have one or more of these co-morbidities. Therefore, presence of one or more co-morbidities in the those hospitalised is statistically significant.
Other co-morbidities were recorded in the full study but the graph reports those that have the strongest correlations.
Hospitalisations in the 30 days of the study represented an average of 4.6 people per 100,000 of the population.
**********
Study 2:
A separate study carried out by the CDC on 122,000 laboratory confirmed cases of COVID-19, showed that those with one or more co-morbidiities were more than 4 times more likely to need hospitalisation than those with no co-morbitiies. The co-morbidities studied here were: diabetes, chronic lung disease, cardiovascular disease, immunocompromised conditions, chronic renal disease, hypertension.
Obesity was not included as a co-morbiditiy in this study.
In this study the most prevalent condition in the hospitalised was diabetes; the least hypertension.
**********
Study 3:
A study of 1590 hospital patients in China.
This study showed that the presence of 1 co-morbidiiy increased the risk of a severe outcome of COVID-19 (hospitalisation) by 80%. (An increase of 100% would double your risk).
Presence of 2 or more, increased the risk by 260%. (An increase of 300% would represent a tripling of the risk).
The co-morbidiites included in this study were: hypertension, cardiovascular diseases, cerebrovascular diseases, diabetes, hepatitis B infections, COPD, chronic kidney diseases, malignancy and immunodeficiency.
The study identified that the three most strongly correlated with COVID outcome were diabetes, hypertension and COPD.
Obesity was not included as a co-morbiditiy in this study.
**********
Study 4:
A study of 175 patients at a Wuhan hospital showed that those patients admitted COVID-19 and with diabetes but no other co-morbidity were at higher risk of severe pneumonia and signs of excessive immunological response to the virus. CT scans of those patients showed more severe pathological changes than those patients without diabetes.
**********
Study 5:
An examination of 1100 patient cases from China.
This study compared ‘critical endpoint cases’ (cases that lead to admission to ICU, mechanical ventilation or death) versus those cases that did not (which includes therefore hospitalisation but excludes hospital cases with critical end point).
The prevalence of co-morbidites in critical endpoint cases (CEC) were compared to non endpoint cases. The relative risk can then be determined:
COPD increased the likelihood of CEC by a factor of 20 (i.e. 20 times more likely)
Diabetes by a factor of 4.4
Hypertension by a factor 2.6
CHD by a factor of 4.5
CVD by a factor of 5.5
Cancer by a factor of 1.7
Renal disease by a factor of 5
The last four in the list are less statistically robust estimates as the sample size of patients with these conditions is small.
Obesity was not included as a co-morbiditiy in this study.